
Pictures
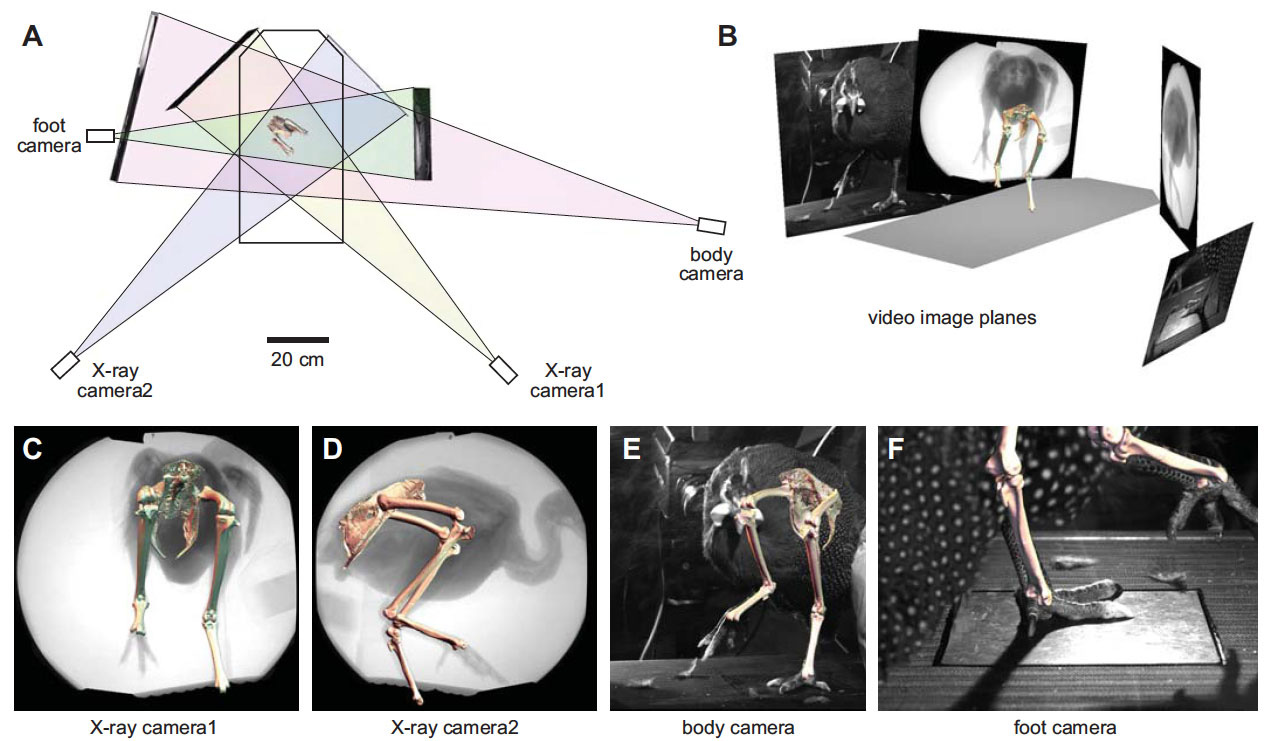
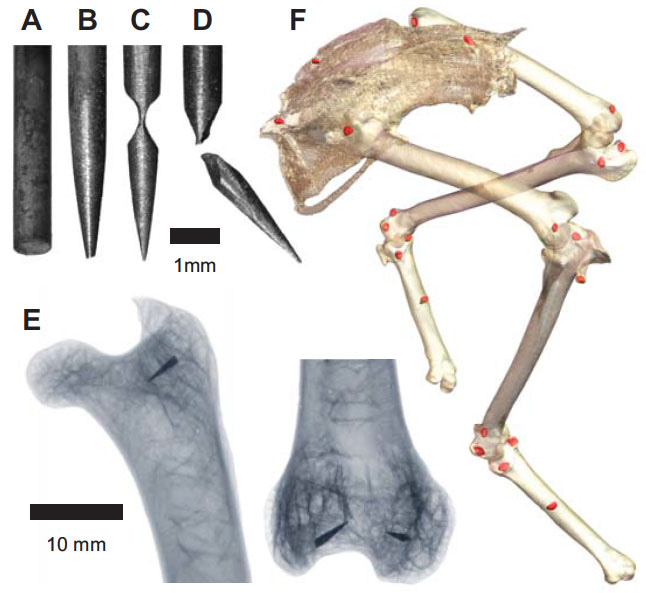
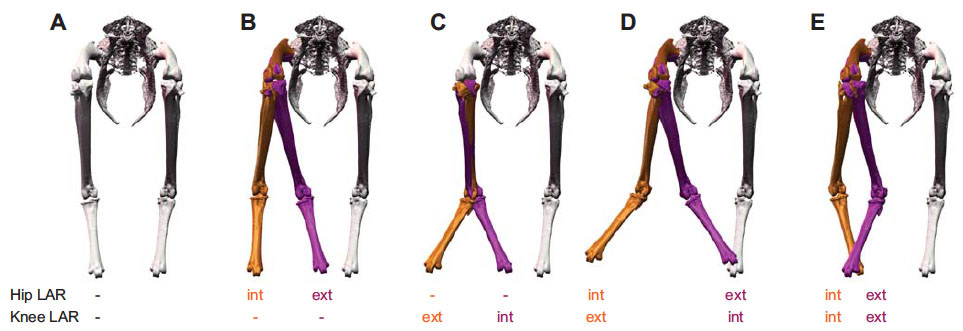
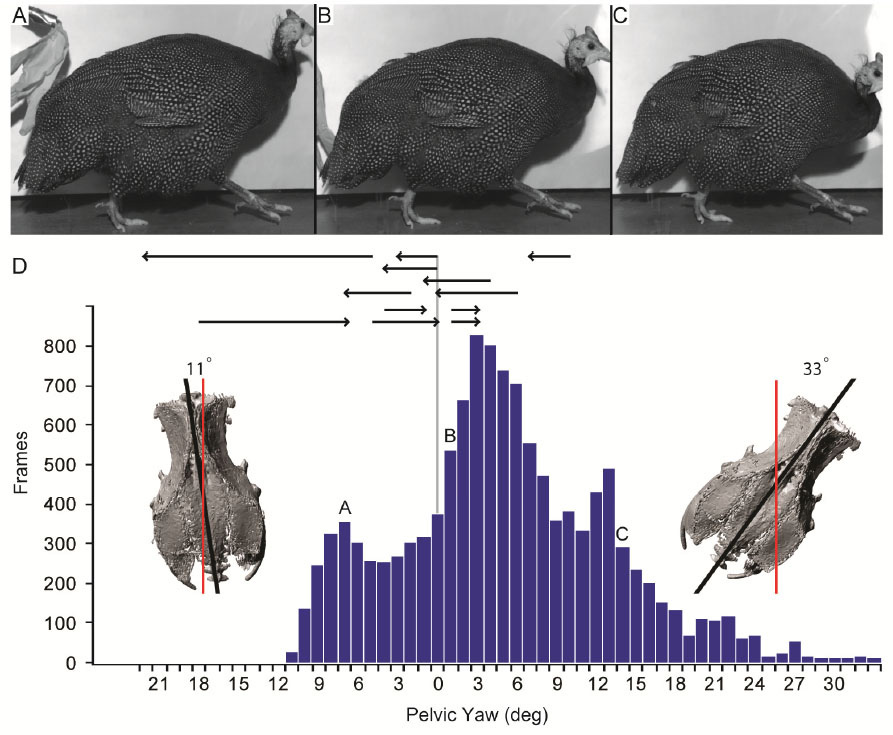
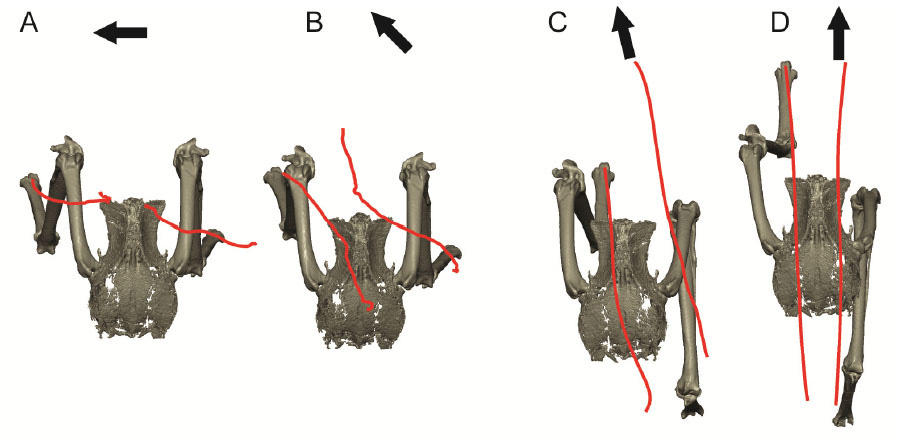
Long-Axis Rotation
A missing degree of freedom in avian bipedal locomotion
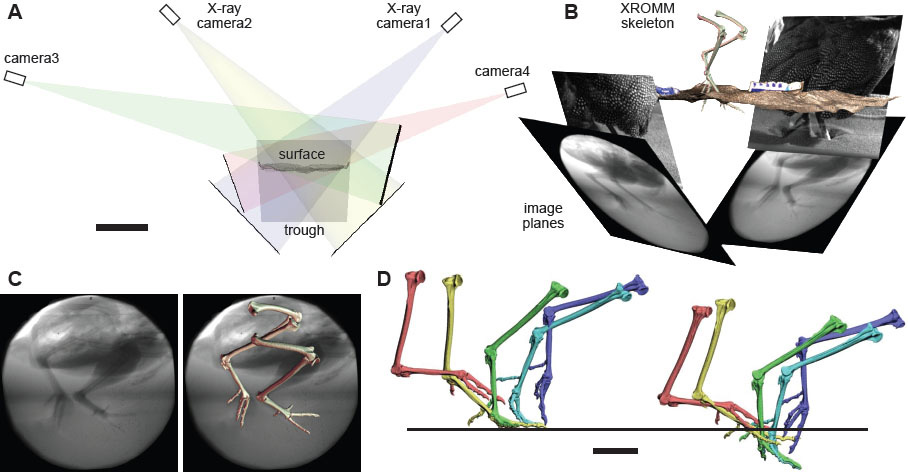
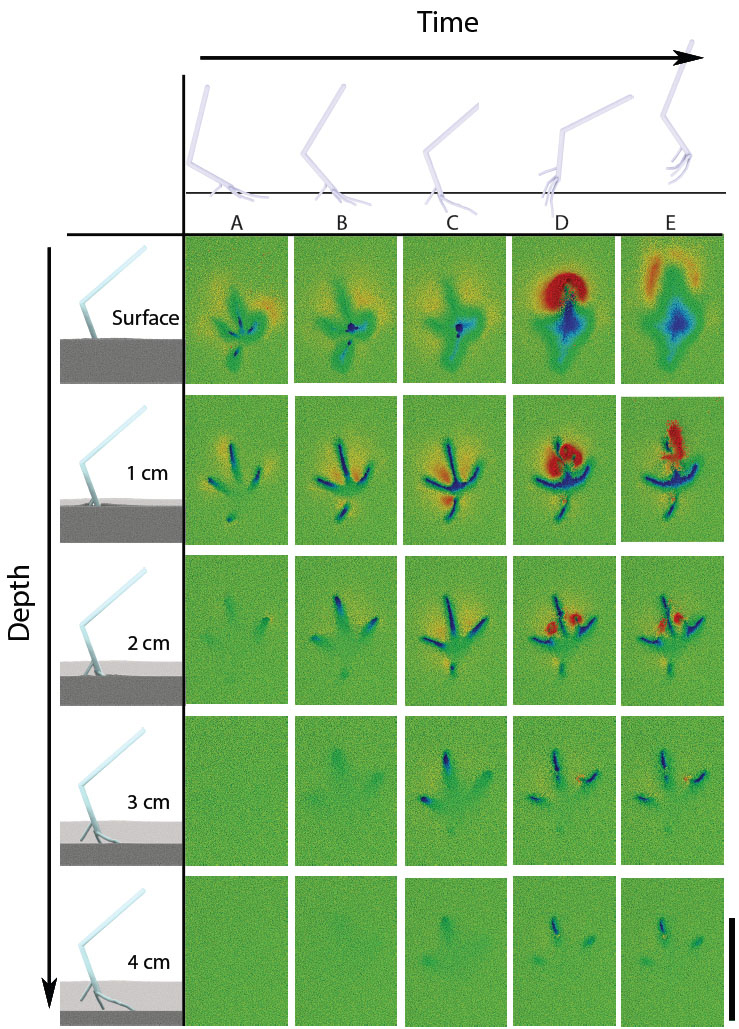
Birth of a Dinosaur Footprint
Subsurface 3D motion reconstruction and discrete element simulation reveal track ontogeny
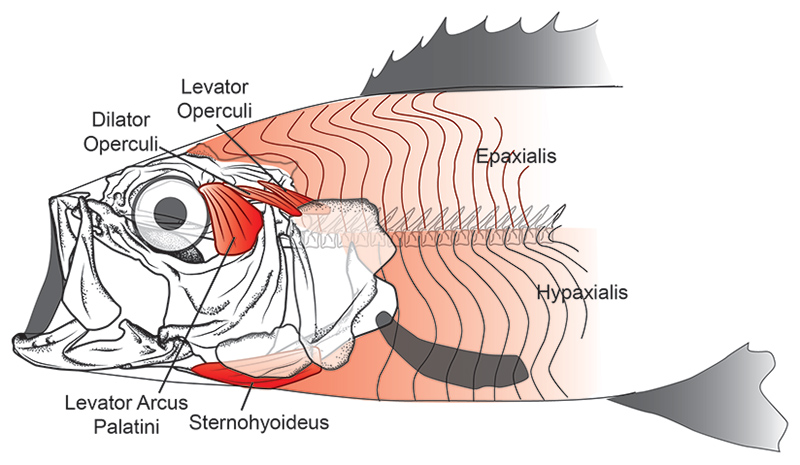
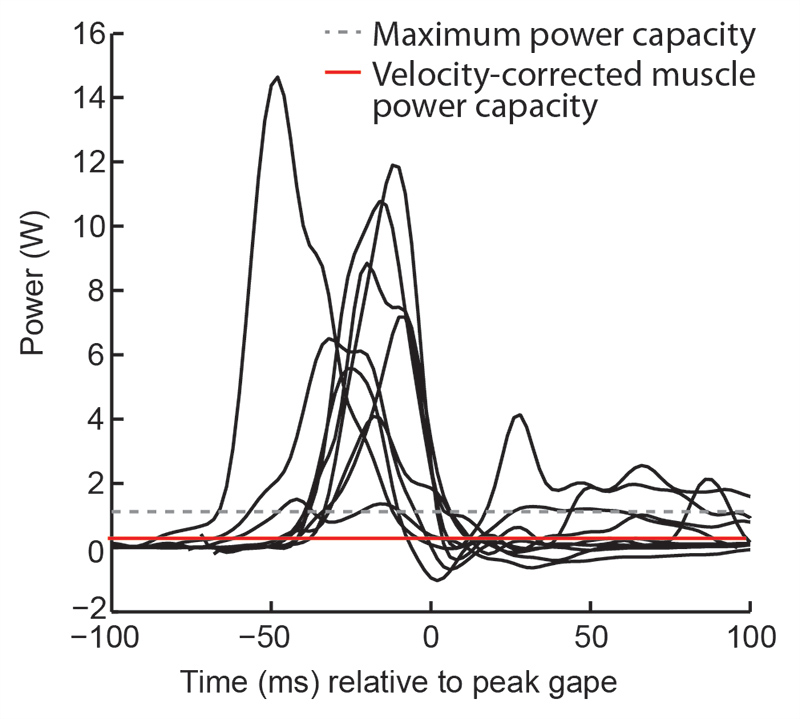
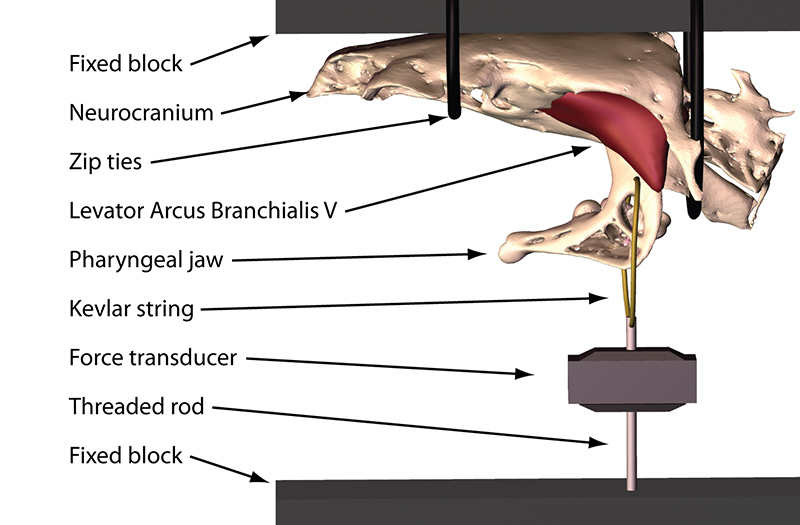
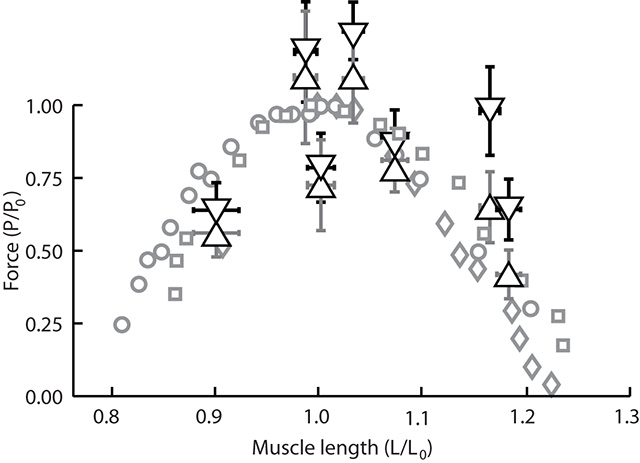
Fish Suction Power
Swimming muscles power suction feeding in largemouth bass
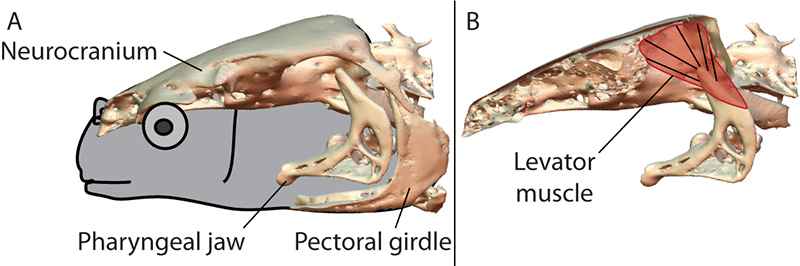
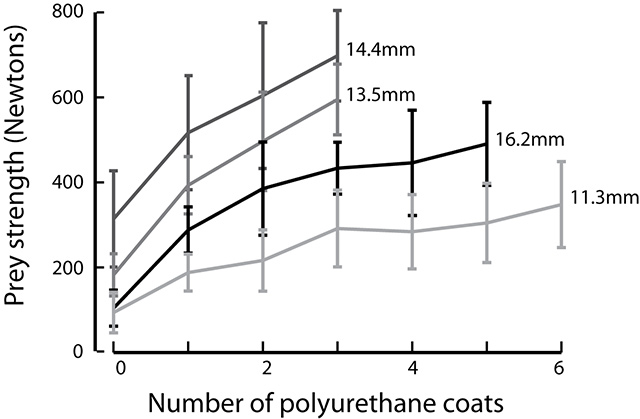
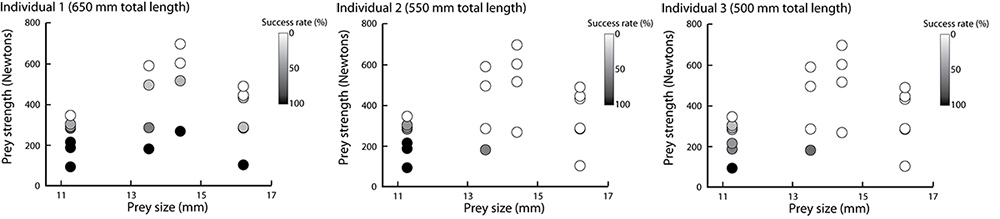
Fish Bite Force
Gape-specific bite force and prey-size specific predator performance in
the snail-eating black carp
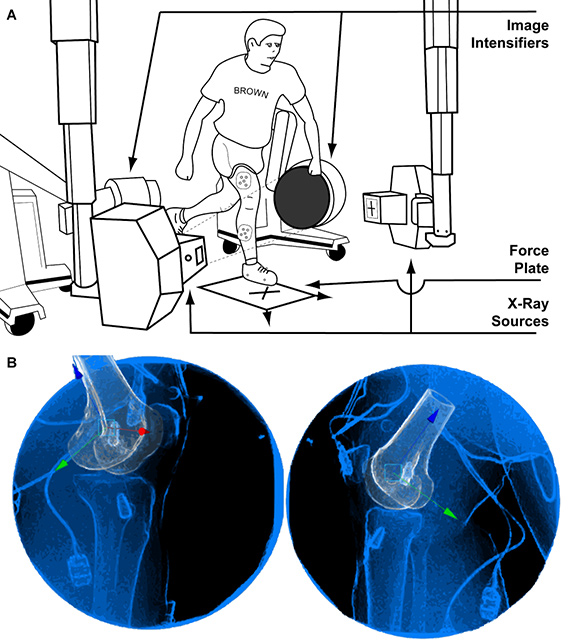
Jump Cut
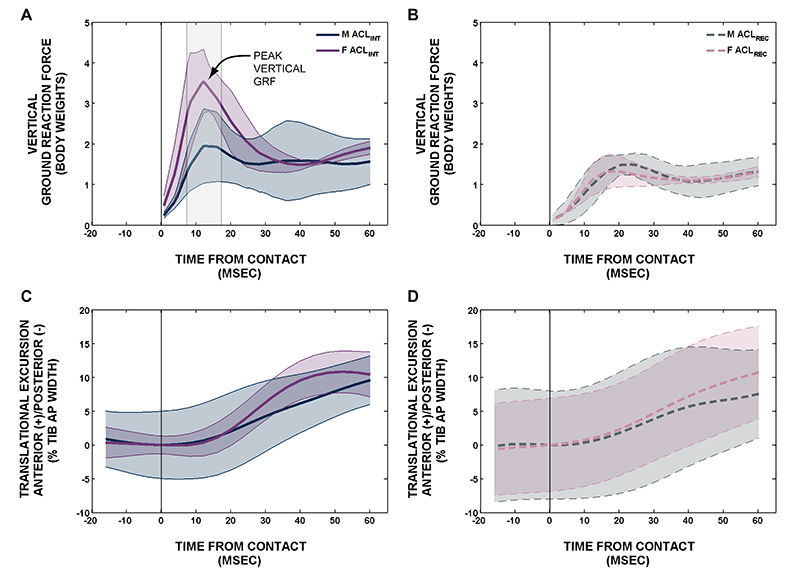
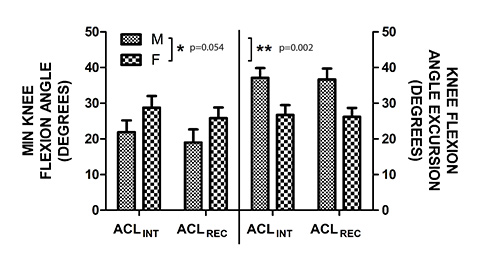
Biomechanics of male and female ACL-intact and ACL-reconstructed
athletes during a jump-cut maneuver
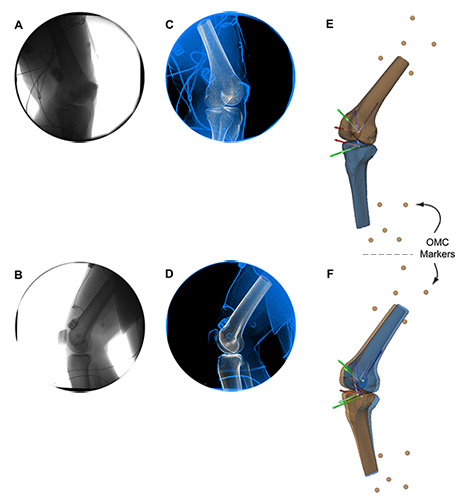
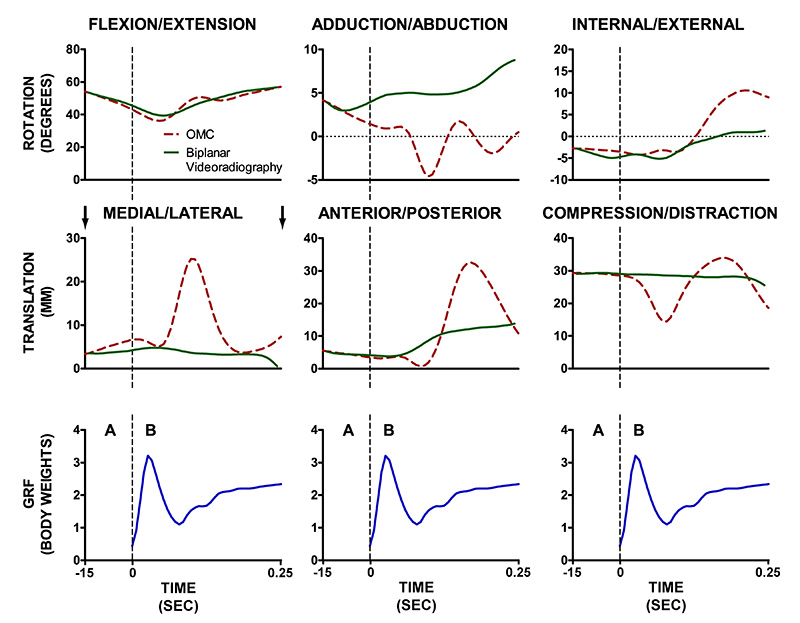
Soft Tissue Artifact
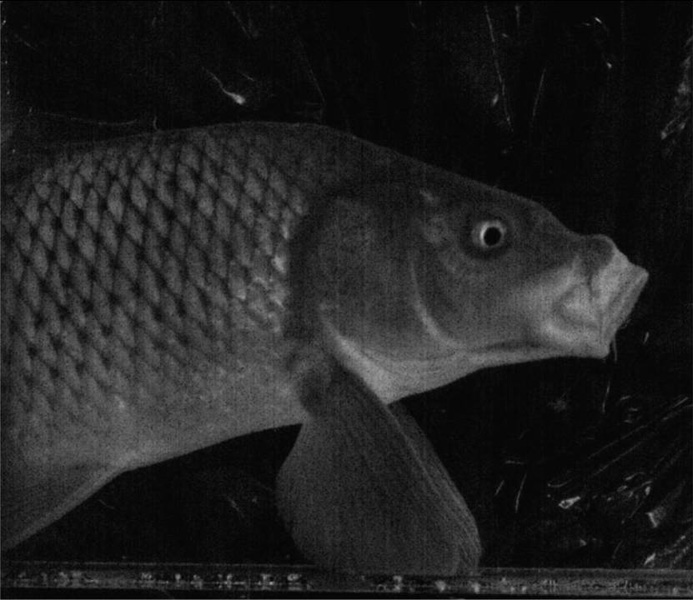
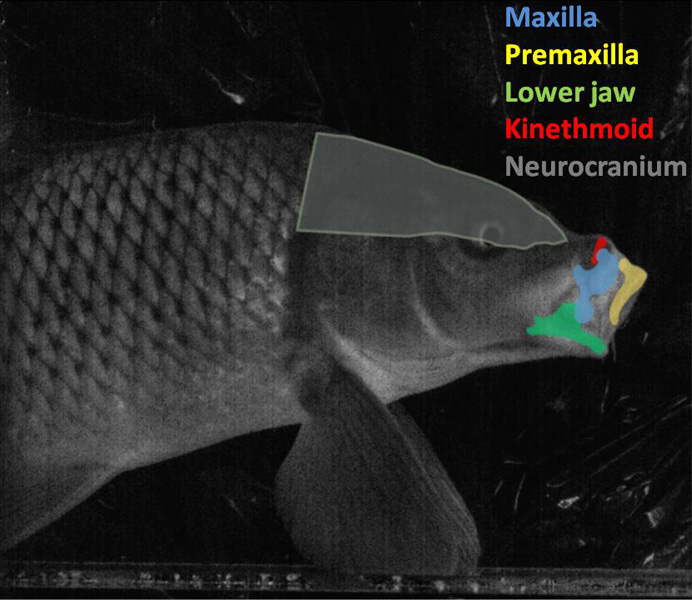
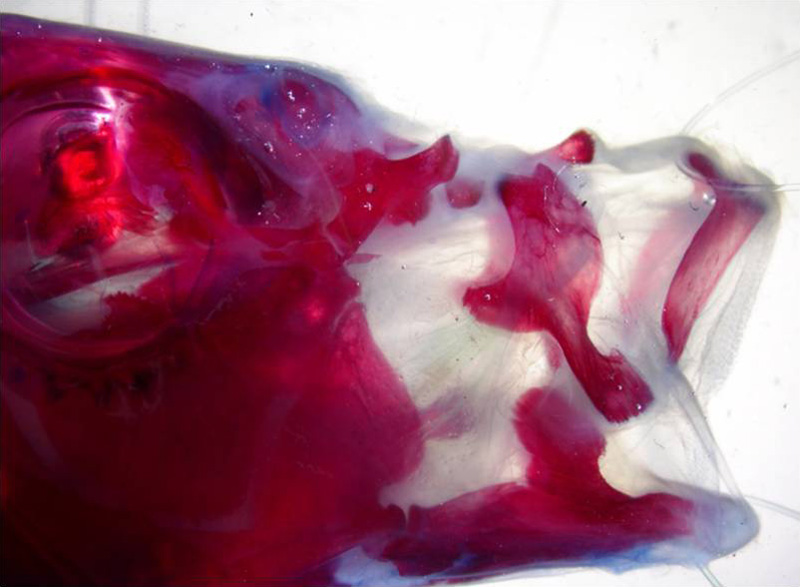
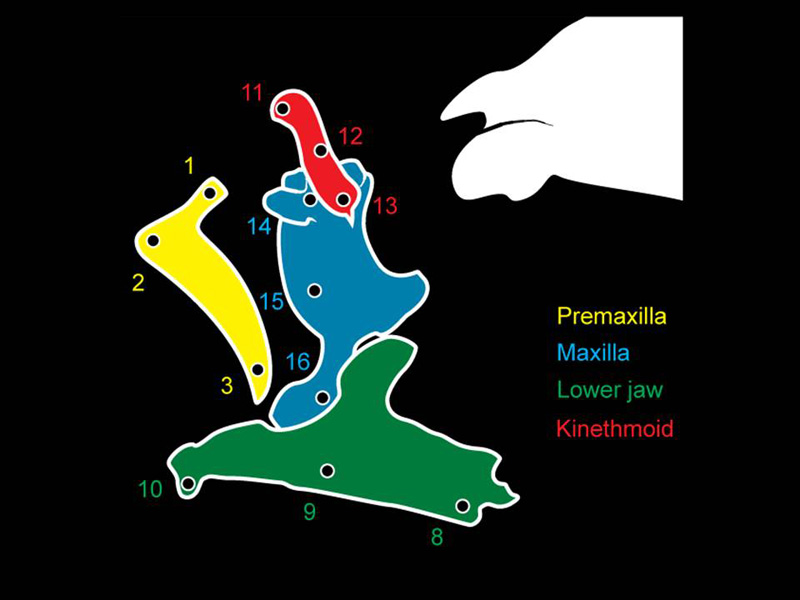
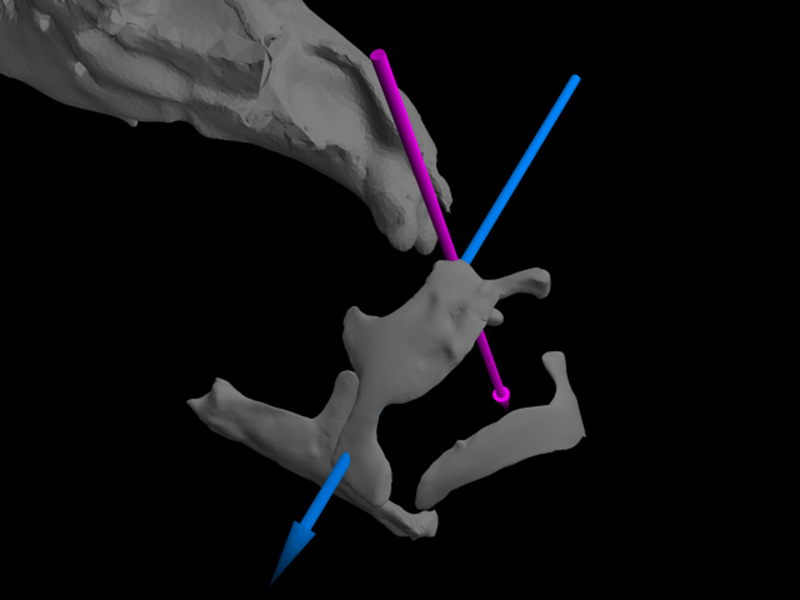
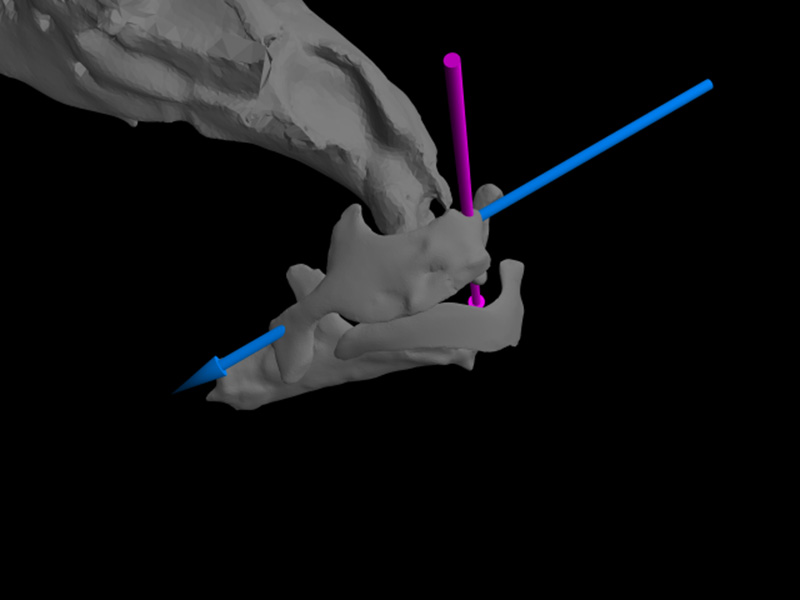
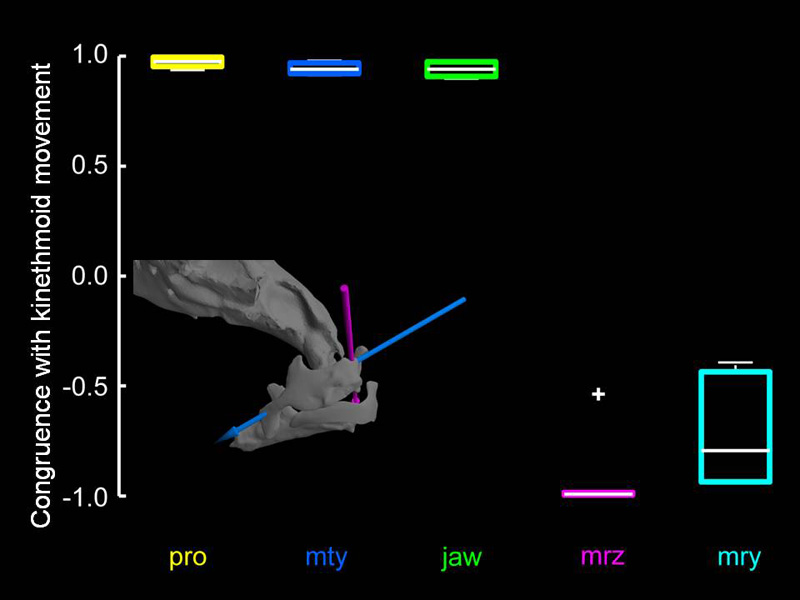
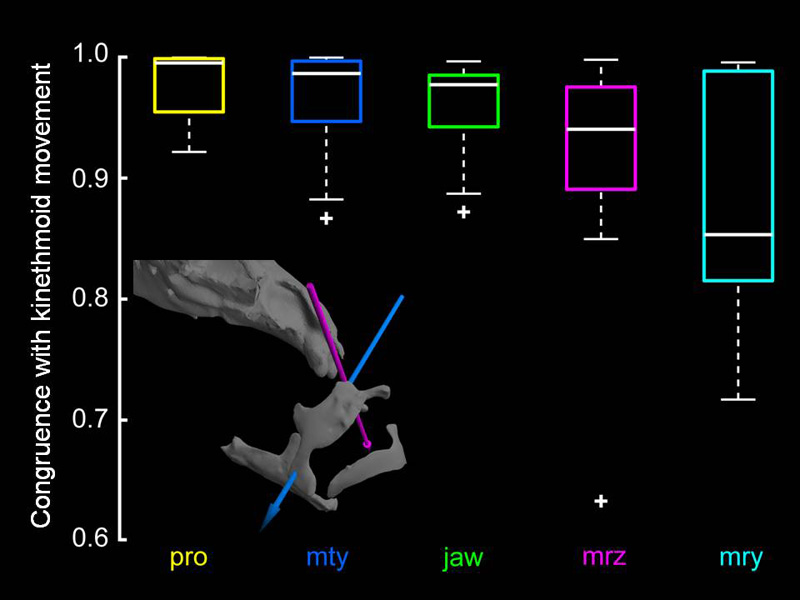
Fish Feeding
Biomechanics of jaw protrusion in common carp
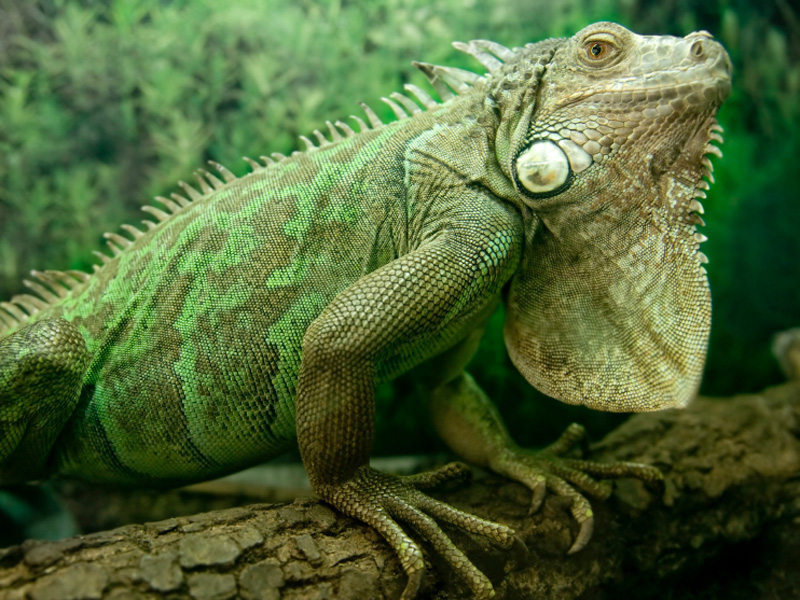
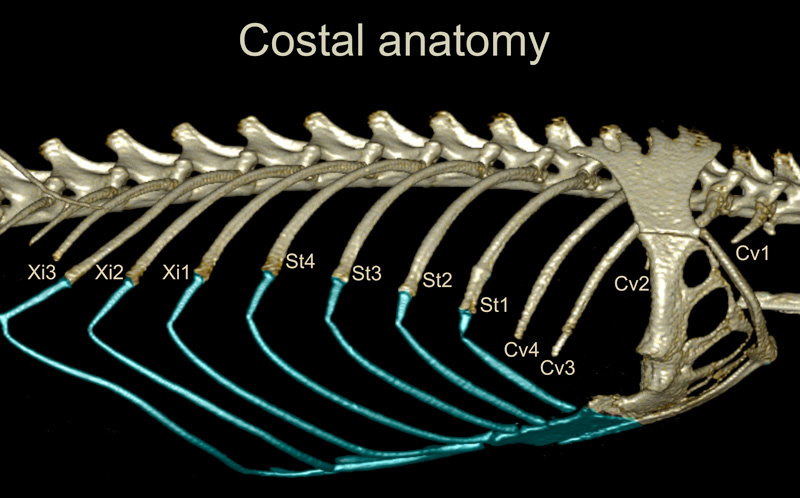
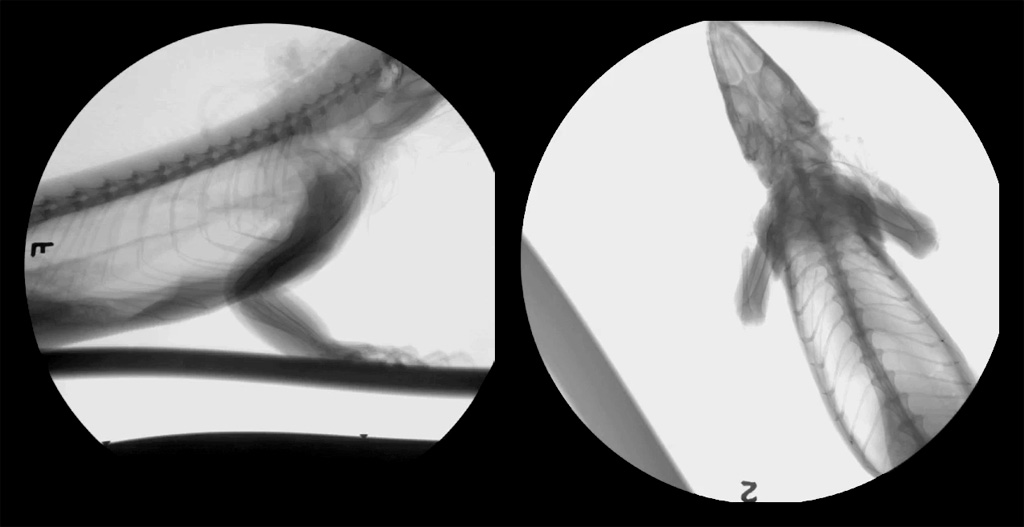
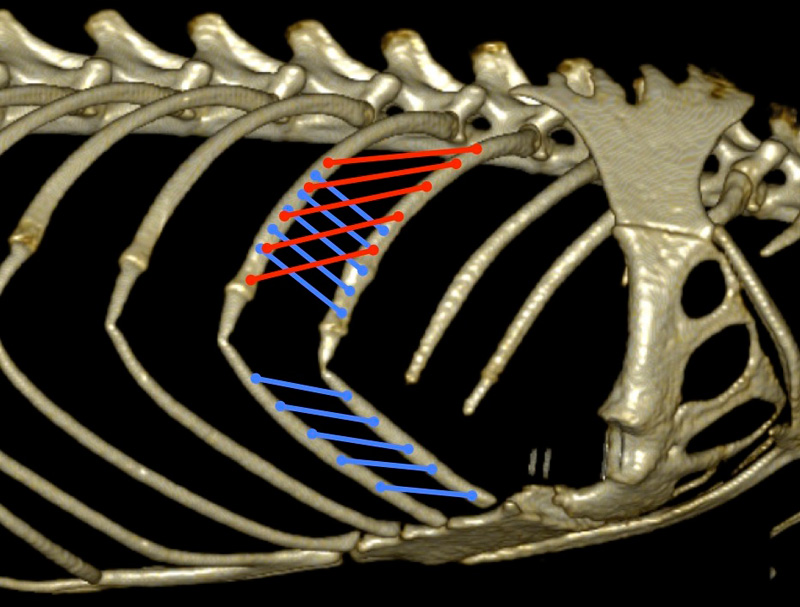
Iguana Breathing
Rib kinematics & intercostal muscle strain during breathing
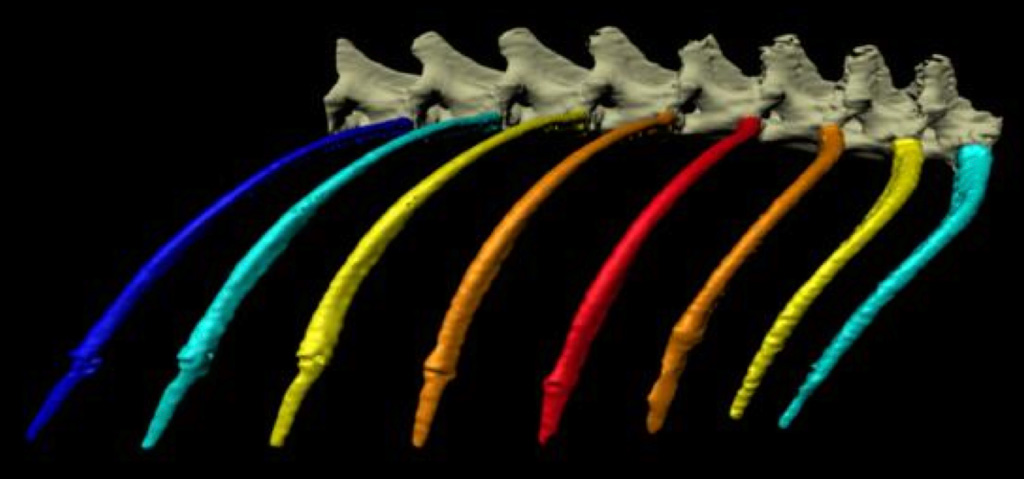
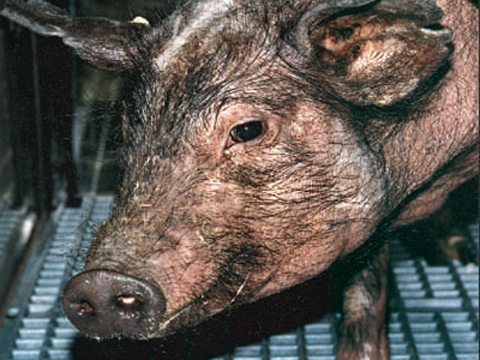
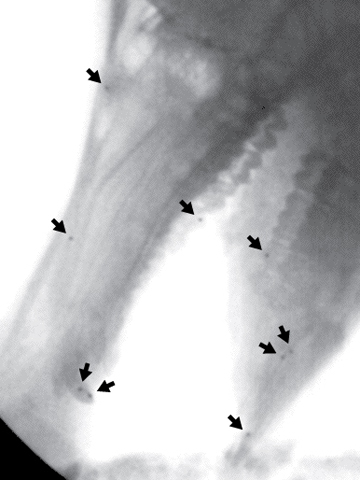
Pig Feeding
Marker-based XROMM analysis of mastication in minipigs
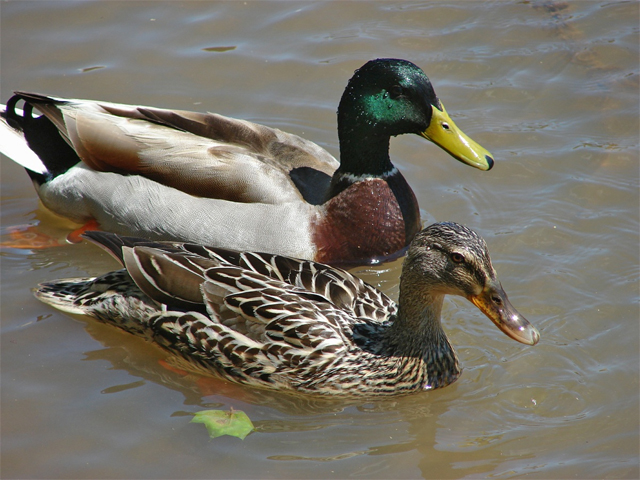
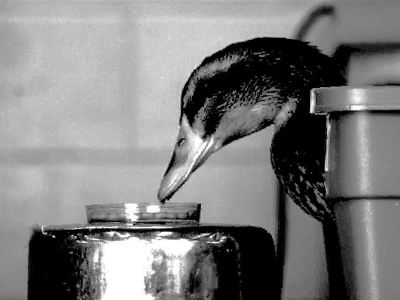
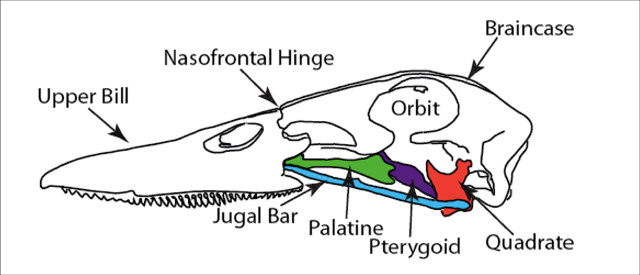
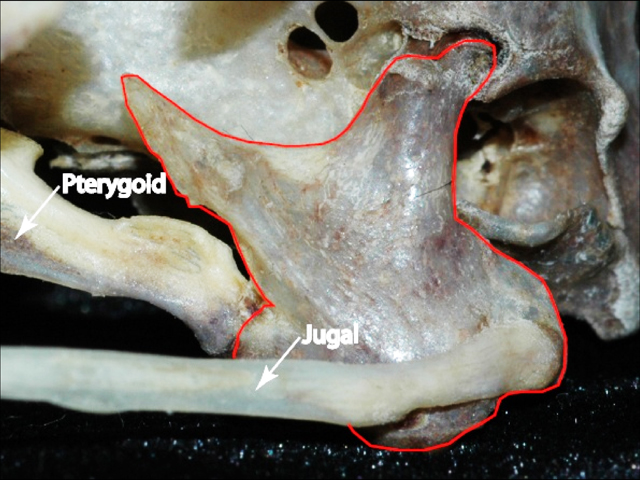
Duck Feeding
Kinematics of the quadrate bone during feeding in mallard ducks
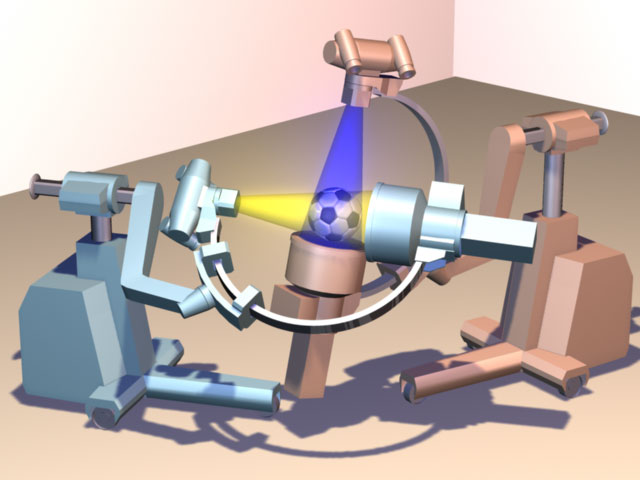
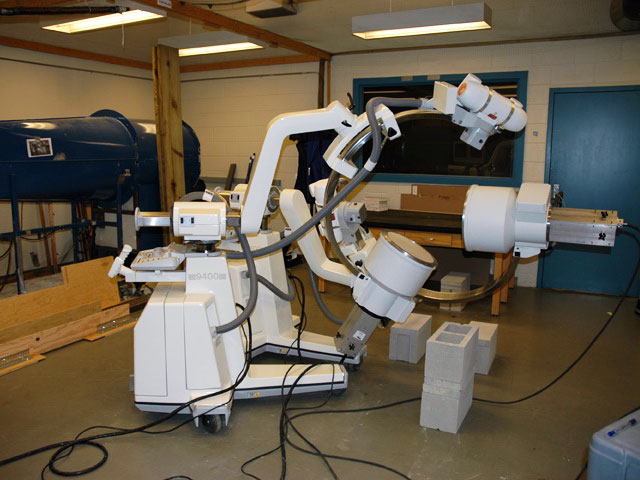
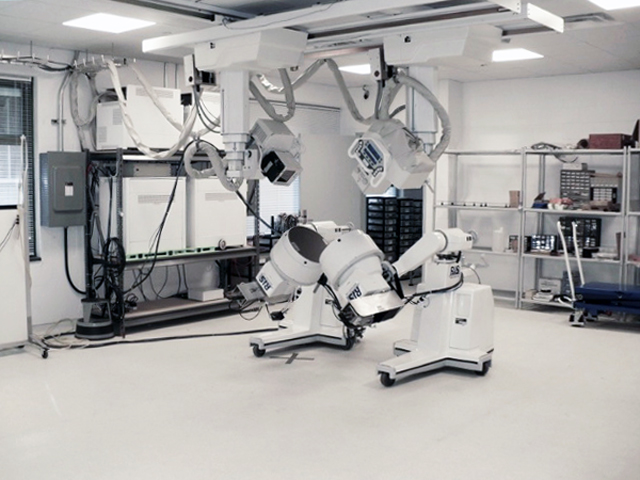
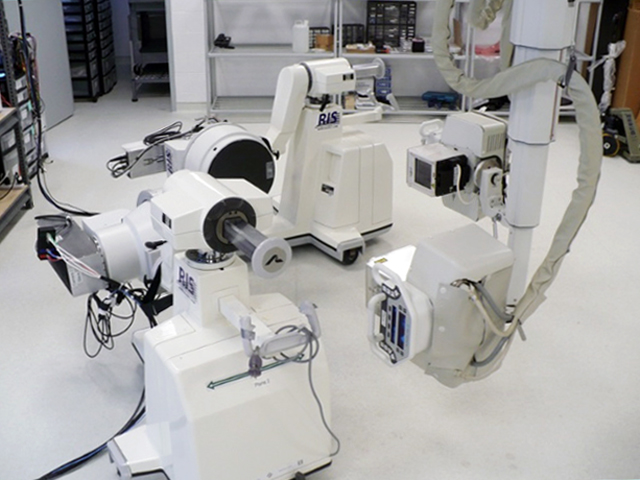
Hardware
Mobile C-arm fluoroscopes and biplanar x-ray rooms